What is different from other programs?
Iterative:
It works with iteration, which is applicable to any kind of function and often more precise because there is no need to take logarithms of variables or do any unnecessary transformations.
And it will assist you to estimate good initial parameter values, in order to have a quick convergence in most cases!Weighted:
Some measurements are more precise or reliable than others. Most programs just neglect this and produce parameters that are not optimal. Here, the weights of the data points are taken into account, using the standard deviations (confidence intervals or measuring errors) of both x and y variables! They are also used to make a realistic estimation of the parameter confidence intervals, taking the error propagation through the model function into account, using a Monte Carlo technique!Interactive:
Most programs just produce a ton of numbers and graphs, and you have no idea how they were produced and how reliable they are. With this program you can visually follow the iteration proces and test what happens if you change the parameters, and that can give you a lot of insight in the stability and the suitability of the model! This also makes it interesting to show in a classroom!A wide range of models:
Model functions in this version:
- Polynomials: constant, linear, quadratic, cubic, Hermite polynomials (9th degree)
- Nonpolynomial monotonous functions with no horizontal asymptotes: power, power with horizontal shift, refractive index, logarithmic shifted through O, "power-Möbius", power∙exponential decay
- Nonpolynomial monotonous functions with 1 horizontal asymptote: exponential+baseline, plateau-exponential, diode, Weibull growth/decay, rational (Michaelis-Menten) and another one, parallax, power (negative exponent), RL and RC serial filter transfer
- Nonpolynomial monotonous functions with 2 horizontal asymptotes: logistic+baseline, transition, Gompertz growth
- with 2 oblique/horizontal asymptotes: "LogExp" and "Transistor-CE" (2 smoothly connected lines)
- Peak functions: Gauss distribution (1 or 2 peaks), Dagum distribution, double logistic+baseline, 2 skewed peak functions with baseline, Lorentzian peak, RLC serial filter transfer
- Other functions with 1 extremum: chain line (cosh)
- Periodic and semiperiodic functions: sine wave, added sine waves, damped sine, sine with harmonics, periodic peaks, skewed wave (periodic but asymmetrical!).
I will add more model functions and examples according to your needs!
Examples included:
Being an experimental physicist, I have personally tested every model with real world data, from physics, electronics, engineering, biology, medical science, agriculture, meteorology, psychology, demography, geography, sports, linguistics, oenology,... These (112) example files are included for educational purposes. You can find them explained in the 165 page manual too. I have also written a book in which I explain a lot more.
The program can also generate simulation data with one click!
Improved regression algorithm:
Normally, the model parameters are optimized by minimizing the sum of the squares of the predicted minus the observed y values. This is called 'Ordinary Least Squares fitting'. This works reasonably well in case the data don't have much "noise" (short for anything that causes the data points to spread out around the curve).
Unique in this program: in the case of invertible model functions, the fitting can be done in x and y directions, which gives a dramatical improvement!
I call this 'multidirectional regression' (MDLS; not to be confused with 'total least squares' or 'Deming/orthogonal regression').
Especially for power function models with noisy data (e.g. biometric data) my program produces way better results than other well known software (e.g. Wolfram, GraphPad Prism, GeoGebra, Graphmatica, TI-84, NCSS, SPSS, R, Stata, MathLab...)! And exploring your data is much easier with FittingKVdm; no coding is required! Don't believe me, just try it!
Remark: Stock market gurus or other economic number crunchers will not have benefits from this, since they only study trends, not causal relationships.
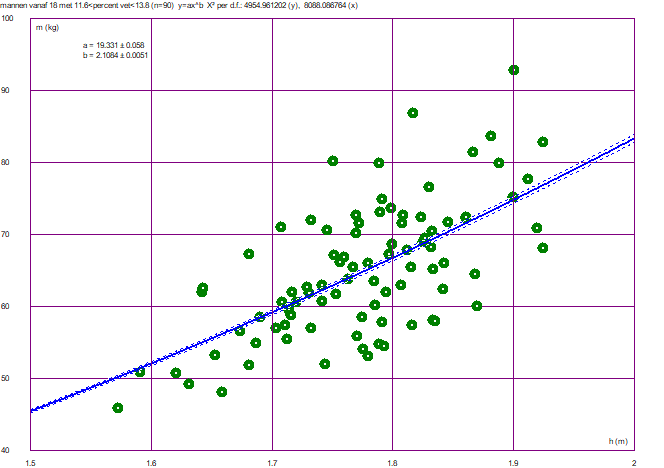
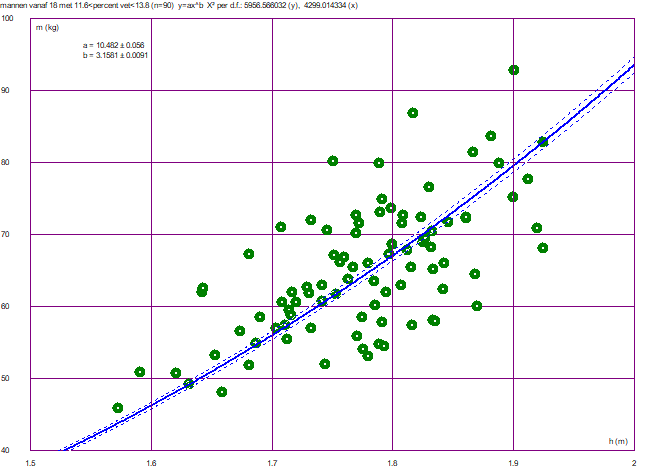
Ordinary and multidirectional fitting applied to mass vs height data of adult men with fat% between 11.6 and 13.8, showing that the BMI should be closer to m/h³ than to m/h².
Other features:
Elementary statistics of the data set (averages, standard deviations, medians and quartiles, Kendall's tau); evaluation of the model function (and it's inverse if applicable); differential and integral calculation; scatterplot or histogram, residual graph, moving average (horizontal and vertical if MDLS is used), visialization of the cross-correlation with the sine function. The results can be saved in a HTML file with embedded "Scalable Vector Graphic" (SVG). Example
Short introduction video; watch fullscreen for best quality.
Personal assistance:
You don't know what to do with your data? Trouble finding a good experiment setup, a measurement strategy, calibration? Confused about all the methods that exist? Questions about the most efficient usage of this program?
I can assist you personally to help you solve your research challenges. In spite of my long experience in math & physics tutoring, of course I don't have all the answers, but asking is free! No cure, no pay!
I wrote this software in Embarcadero Delphi 10.4 (Pascal); if you need custom scientific software in that language, I can also assist you.
|
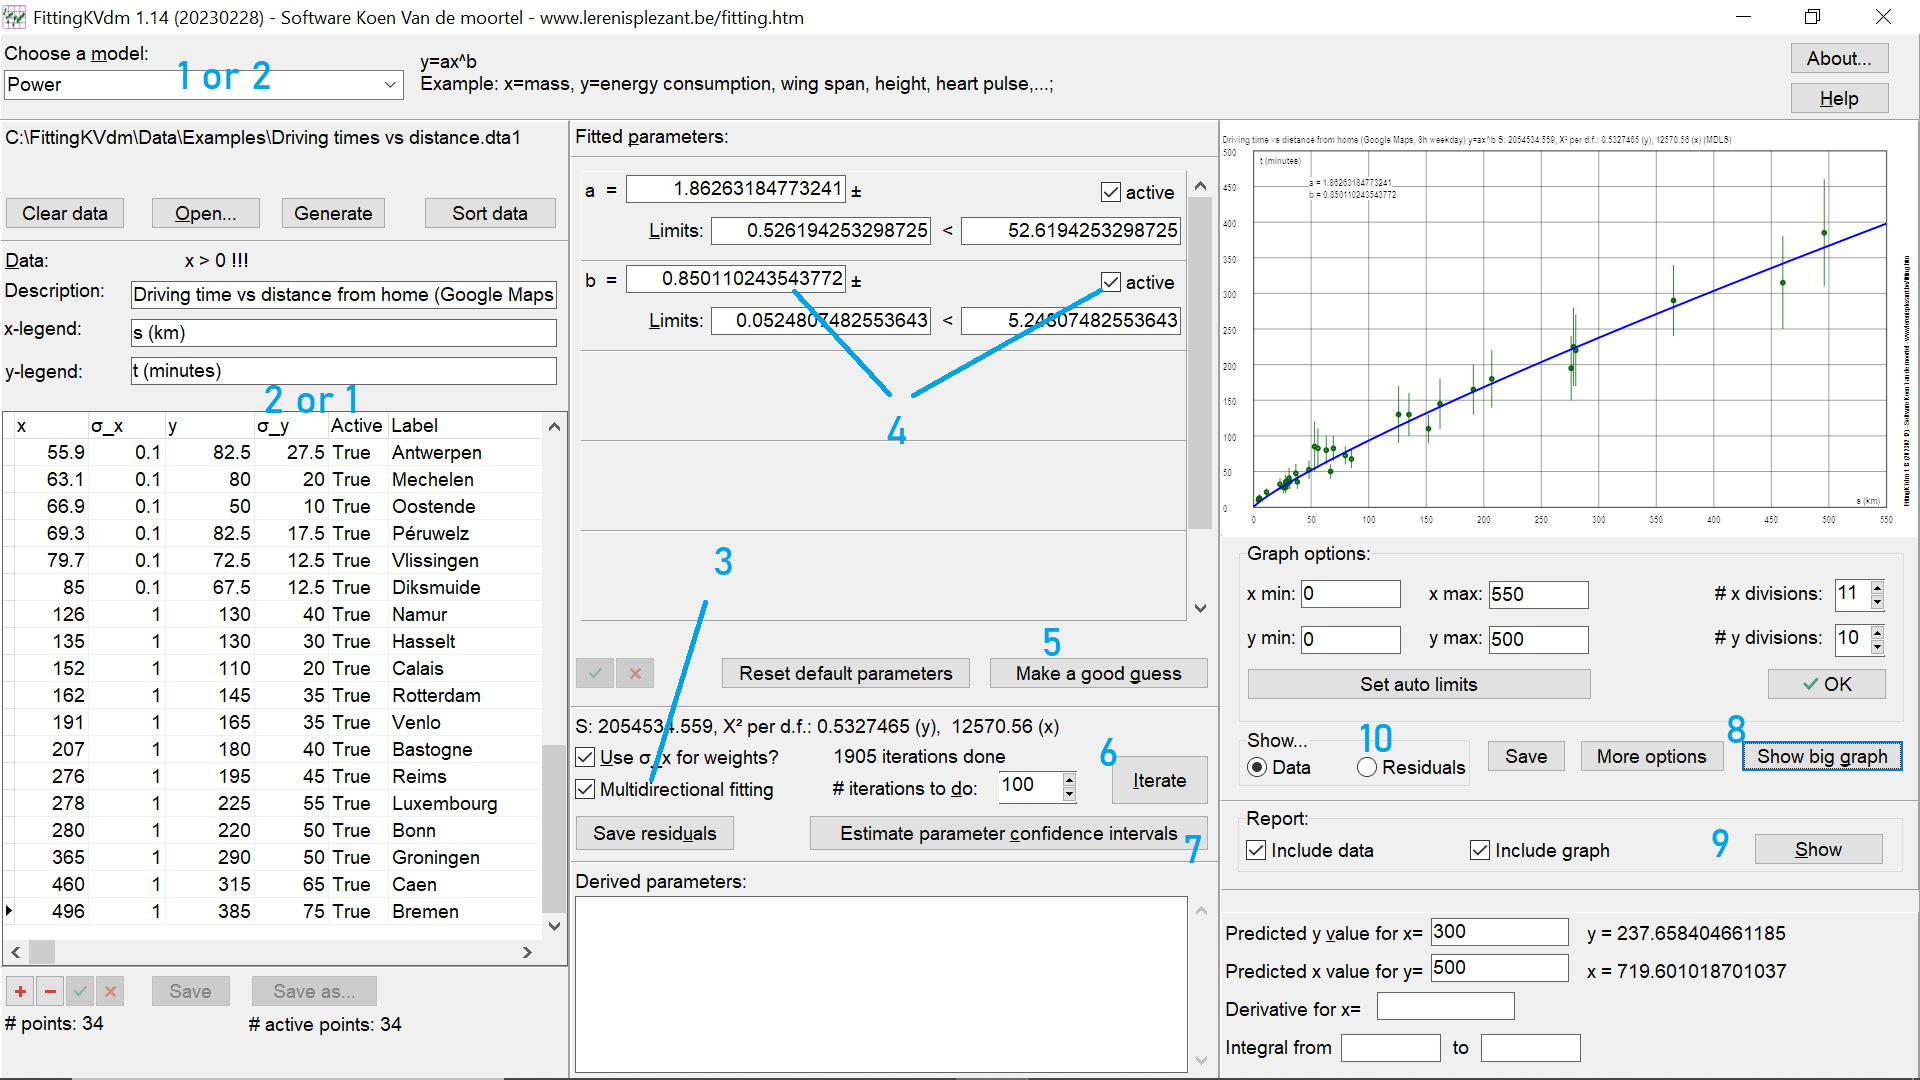
Screenshot:
Version history: The first version of this software program was released the 10th of April, 2021.
- Version 1.4 (12 July 2022): New model: "Transition"; more general "Logistic with baseline" and "Exponential with baseline", new examples, and improved first estimates.
- Version 1.5 (17 July 2022): New model: "Periodic peaks"; improved algorithm for the first estimation of periods and phase shifts (Sine etc.); new examples.
- Version 1.6 (27 July 2022): Studying the residuals has been made easier; most parameters can be fixed (inactivated) before the "first guess"; added to the report: elementary statistics like averages, standard deviations, medians and quartiles, Kendall's tau; better automatic graph scale; improved algorithm for the first estimation of the "double logistic" model.
- Version 1.7 (20 August 2022): New models: "Hermite polynomial" & "Gompertz growth"; new graph option; some algorithm optimizations...
- Version 1.8 (8 September 2022): New models: "Weibull growth/decay", 2 "skewed peak functions", "Dagum distribution"; improved first estimations; data sort button; more example files,...
- Version 1.8.1 (20 September 2022): Added example from linguistics. Many checks to make the program more "monkeyproof", to avoid hanging or crashing if you entered bad data or initial parameters; the parameters are not anymore reset automatically if you change some data values; better parameter estimation for several models,... this will make many users happy!
- Version 1.8.2 (26 September 2022): Even more security checks to avoid hanging.
- Version 1.9 (10 November 2022): Integral and differential calculation; better initial parameter estimation with the exponential model; 4 more example files (friction, fuel consumption, sponge compression, heart beat recovery).
- Version 1.9.1 (27 December 2022): Fix of a bug (introduced in v. 1.9) that could occur in the exponential model; 4 more example files (concrete strength vs time & cement; tumor growth; smoking behaviour evolution).
- Version 1.10 (6 January 2023): Fix of a bug (introduced in v. 1.9) that could make the estimation of the parameter confidence interval unstable; new model: "Diode"; example files: diodes, wine ratings.
- Version 1.11 (25 January 2023): New model: "Power with horizontal shift"; more robust handling of numerical overflows, improved first estimations; example files: lactose powder flow, radioactive decay (Radon220), Noble prizes & chocolate consumption.
- Version 1.12 (31 January 2023): "Abort" button to interrupt unexpectedly long iterations; better period estimation ("Sine" model etc.); even better handling of overflows and exceptional situations, also in the graph.
- Version 1.13 (12 February 2023): Graphs are now in "SVG" format (much better for publishing), and embedded in the HTML report file; some bugs from the previous version were fixed (possible overflow/underflow in the Gauss model,...).
- Version 1.14 (28 February 2023): New models: "chain line", "lorentzian peak"; "RLC, RC and RL serial filter"; new examples: hanging chains, RLC filter measurements, shoe sizes vs body heights; optional transparent points on the graph (useful to indicate that multiple points are present with the same values); graph options are remembered; parameters can be changed simply with up and down keys (very pleasant for exploring models!); simulation data can be easily be generated!
- Version 1.14.1 (1 March 2023): A rare bug in the graph (if ">" or "<" characters were present in the title) was fixed.
- Version 1.14.2 (23 March 2023): Data and label are shown if you hover over a point in the graph; small changes in the SVG format to make it more compatible; first guess for the "Rational 1" model improved.
- Version 1.14.3 (16 July 2023): Small bug fix ("&" character in file caused trouble in graph); 7 new examples: cell phone usage evolution, survival, child mortality & water, average temperature vs latitude, ages of married couples, examination scores vs completion time, Janka hardness vs density of eucalyptus wood
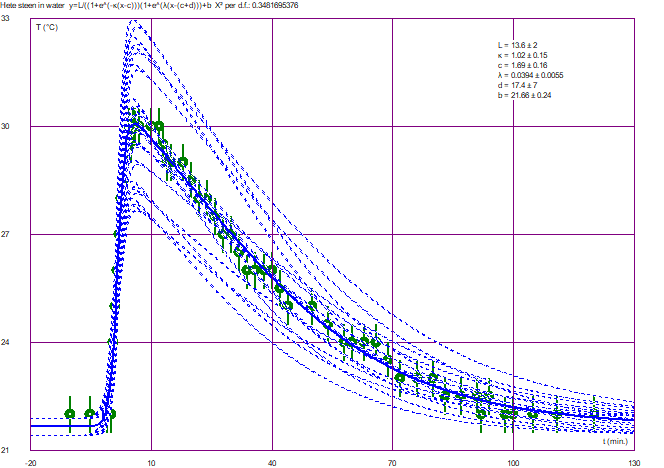
- Version 1.15 (6 August 2023): Small bug fixes; new example: temperature evolution on 1 day; graph option: moving average; new model: "skewed wave".
- Version 1.16 (15 August 2023): "Data check" function to search for suspicious data points (redundant/contradictory/unexpected value); small bug fixes; new example: child vocabulary vs age.
- Version 1.16.1 (19 August 2023): small bug fixes (the algorithm switched sometimes from MDLS to OLS while not necessary; graph improvement near vertical asymptotes).
- Version 1.16.2 (30 August 2023): Pearson R is shown in the report; improved random point generator; small bug fixes.
- Version 1.17 (22 September 2023): New model "logarithmic shifted through 0"; new examples: Food vs total expenditure, Ultra-marathon running times vs age; small bug fixes (e.g. calculation of f'(0) for power functions with negative exponents).
- Version 1.18 (25 November 2023): New models "Power-Möbius", "Power∙Exp.decay"; new examples: pure water conductivity vs T, concrete strength vs water/cement ratio; new graph options: histograms, visialization of the cross-correlation with the sine function; improvements in the estimations of initial parameters and confidence intervals.
- Version 1.18.1 (30 December 2023): Some stability issues (overflow/underflow) with very large numbers were fixed.
- Version 1.18.2 (26 April 2024): Average of x and y residuals is calculated; new examples: air pressure variability in Karlsruhe, blood markers that can predict liver disorders (BUPA), introversion/extraversion related questions, water conductance vs salinity and probe frequency, cell aptosis vs microwave field strength with rats, pendulum with variable length, BMI and CI (corpulence index) vs body fat%.
- Version 1.19 (15 April 2025): New models: "LogExp" & "Transistor-CE"; new examples: light bulb resistance, 2 MOSFET amplifier and a common collector transistor circuit characteristics; small bug fixes (“Power with horizontal shift” model,...).
Requirements: pc with Windows 7 or later/Mac with Windows emulator; recommended screen resolution: 1920x1080 (full HD).
Author: Koen Van de moortel - info@lerenisplezant.be - +32 9 2277036 or +32 47 7368526 - Presentation on Youtube
Support: Fire your questions & requests! I'm not sure if I can answer all of them, but I'll try! - User discussion forum
|